

Assurance in bio-decontamination validation means knowing that the cycle reaches every surface with margin to spare, and that it still does a year after qualification. A PQ that relies only on BIs shows the first on the day it runs, as a pass or fail at each location, and says very little about the second.
A cycle that passes PQ with every BI negative often isn’t looked at again until requalification, and if BIs grow then, the investigation only has the PQ report and the new positives to work from, with no data from the year in between to show when or where things changed.
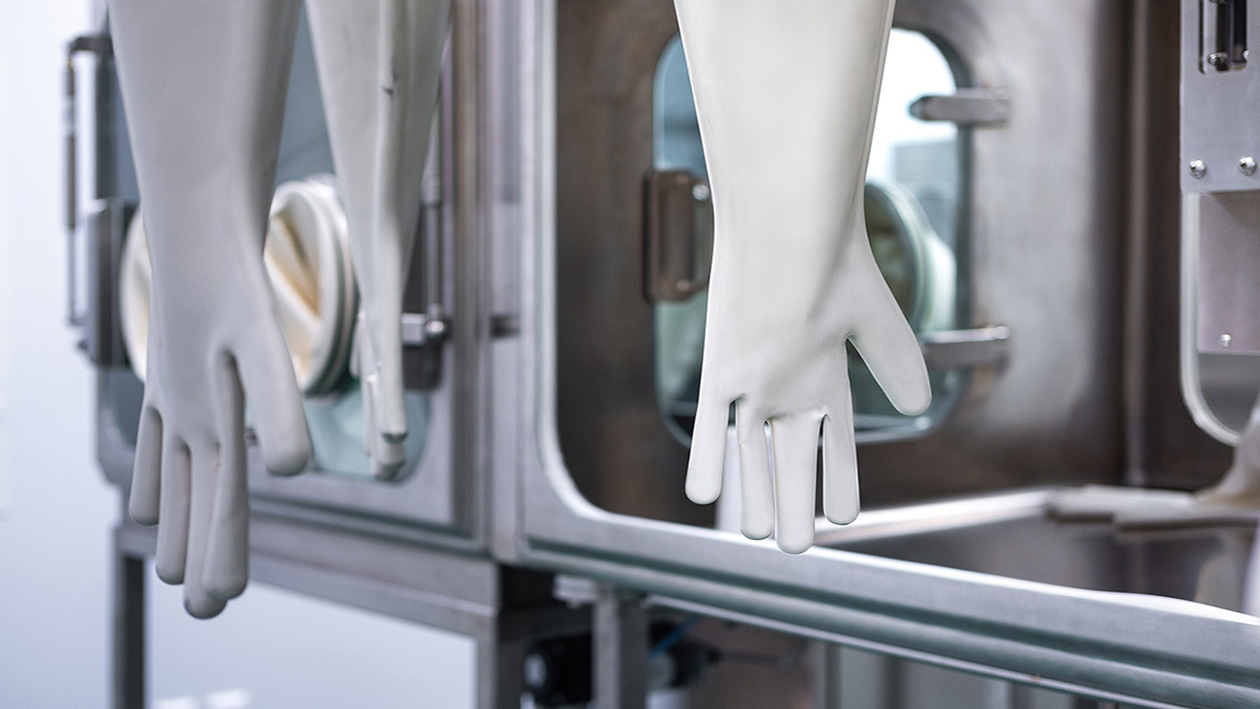
Clause 4.22 of the revised Annex 1 says the bio-decontamination process for an isolator interior “should be automated, validated and controlled within defined cycle parameters and should include a sporicidal agent in a suitable form”, and that gloves “should be appropriately extended with fingers separated to ensure contact with the agent”. The same clause asks for evidence that the cleaning and bio-decontamination agents don’t have an adverse impact on the product. For RABS, clause 4.21(ii) requires gloves to be sterilised or effectively bio-decontaminated by a validated method before each manufacturing campaign.
An inspector reading your PQ will look for the parameters that define the cycle, the reasoning behind your worst-case locations, and data from hard-to-reach locations. Glove fingers are a common worst-case location, and the clause names them specifically.
Vaporised or aerosolised hydrogen peroxide acts on exposed surfaces and doesn’t penetrate materials, so protocols and reports should call it bio-decontamination. Sterilisation belongs to penetrative processes such as steam, dry heat, irradiation and ethylene oxide, and using it in a VHP report is likely to be questioned at audit.
Many cycles that fail at requalification show no change in the recorded cycle parameters. When the generator logs and set points match the PQ report, the investigation has to look at what else has changed since PQ: the vaporiser’s output as it ages, how the load is arranged and held, new glove or gasket materials, and the time of year. Requalification tends to fall in the same month every year, so a cycle qualified in dry winter air may never have been run against the warmer, more humid air it sees six months later, and an investigation may focus on the BIs when environmental conditions are a contributing factor.
Those are the same factors a good user requirements specification defines at the start. If the URS records the materials inside the enclosure, the real load configuration, the limits for temperature, relative humidity and relative saturation, and any areas that could be occluded, such as glove ports, transfer hatches and extract ducts, the cycle is developed against the conditions it will actually run in, and the team has a baseline to compare against when performance changes. This needs doing early, because bio-decontamination qualification is often one of the last validation activities before manufacturing starts, two or more years after the equipment was ordered, and the schedule pressure at that point pushes teams towards a reactive approach.
BIs are still the reference challenge for qualification, but on their own they make repeatability difficult to demonstrate. The 2026 PDA Journal paper on enzyme indicators, written by validation specialists from five pharmaceutical manufacturers, notes that BIs can vary from −50% to +300% of their labelled spore population and that their resistance varies between batches. Each result is binary, and it is available after a typical seven-day incubation.
A single positive doesn’t always mean the location failed. Using the Halvorson-Ziegler most probable number method that Tim Sandle applies to rogue BIs, a location with a starting population of 2 × 10⁶ and one positive out of three replicates still has an estimated log reduction of 6.69, and two positives out of three gives 6.26. That arithmetic helps you decide whether you’re looking at a marginal location or an outlier indicator, although the BI data on its own still can’t show which locations had low margin before they failed. Our Biological Indicators vs Enzyme Indicators page sets out how the two compare.
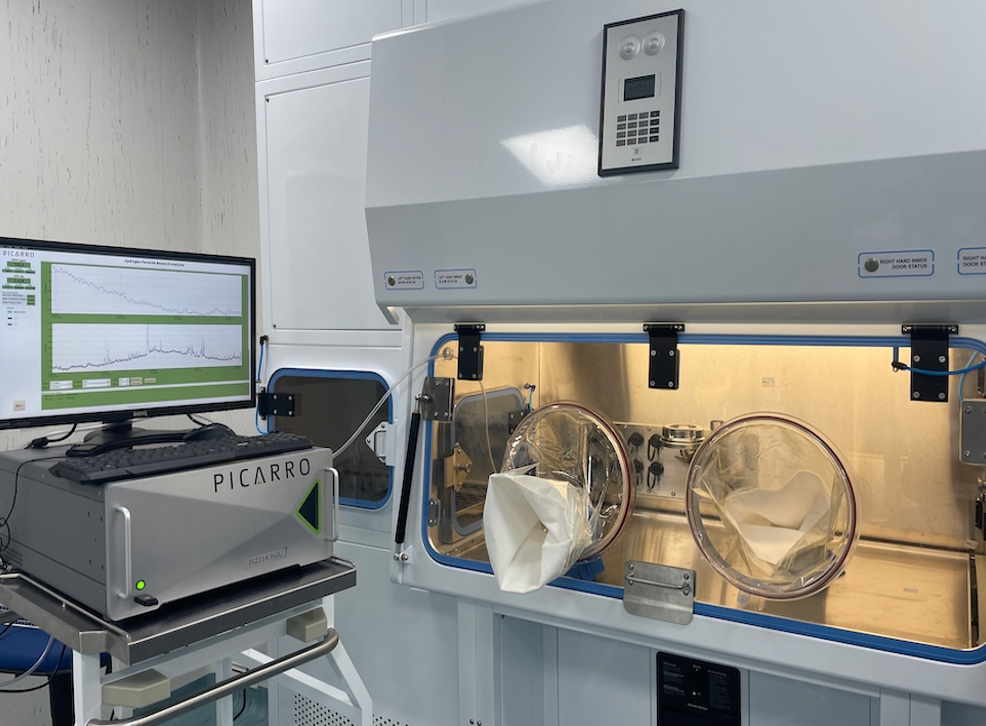
Enzyme Indicators give a quantitative result at each location, read in approximately 60 seconds, and the result relates to the log reduction achieved. During cycle development that means you can test a change to the injection rate, dwell time or load pattern and see its effect at every location the same day, then choose your PQ and requalification challenge locations from the data. That matters at inspection, where the question is usually whether you can scientifically justify where the BIs went, more than how many you used.
The PDA paper pooled more than 6,800 paired EI and BI results from 27 enclosures and 13 hydrogen peroxide systems, and 99.1% of EI results either matched the BI or showed a harsher challenge than the BI did (doi:10.5731/pdajpst.2025-000054.1). EIs are also non-viable, so placing them in a filling isolator doesn’t introduce live organisms. The 2026 revision of PDA Technical Report No. 33 now gives sites a structured route for qualifying adenylate kinase based rapid methods, EIs included, against established BI practice.
Continued process verification (CPV) is how you show the cycle is still behaving the way it did at PQ. For a bio-decontamination cycle that means running EIs at the worst-case locations in routine cycles and trending the results against the qualification data set. If a location such as the floor of the transfer hatch starts to lose the margin it had at PQ, the trend shows it well before a BI is likely to grow, and you can investigate while the cycle is still passing.
Our September panel on continued process verification for VPHP bio-decontamination went through how teams are setting this up, and the recording is on our website.
If you have a requalification coming up, we can go through your challenge locations and cycle data with you before you run it.

Read about the advantages and benefits of using our Enzyme Indicators for your H₂O₂ bio-decontamination validation processes.

Biological Indicators vs Enzyme Indicators at a glance.
Presentations, white papers, webinars, shared articles, project summaries and product analysis.

Luminox House,
48 Holmethorpe Avenue
Redhill, Surrey
RH1 2NL
United Kingdom
Tel: +44 (0) 1737 924 900
Fax: +44 (0) 1737 924 901